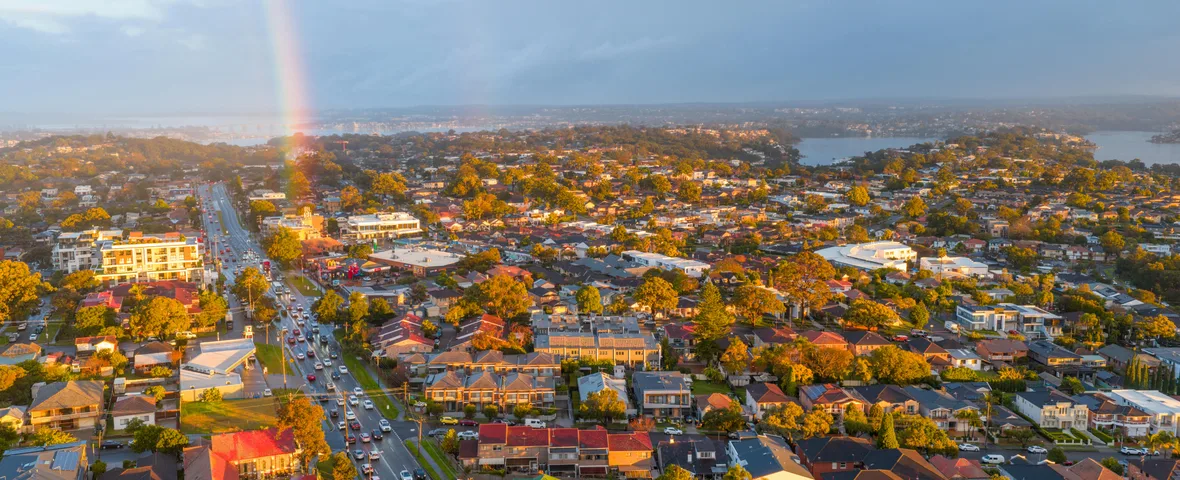
Sydney house prices have fallen for five straight months. Perth dwellings just hit +24% annual growth. Two cities, the same country, two completely different decisions.
For a buyer with $115,000 income and $80,000 saved, the answer to "should I buy now?" depends entirely on which postcode shortlist sits on the kitchen table. The numbers, the borrowing math, and the timing logic are all different — and they all changed on Tuesday 5 May when the RBA pushed the cash rate to 4.35%. Here is what the data actually says, and how to use it before EOFY.
- Westpac revised Sydney 2026 forecast to −3% on 26 May — the most bearish call from a Big 4 since the 12 May Budget, factoring in both the negative-gearing reform and the May rate hike. ANZ now at −0.7%. CBA (+2%) and NAB (+2.4%) have not yet revised post-Budget. Source: Westpac IQ 26 May.
- Sydney auction clearance rate fell to 49% on 16 May — the weakest reading since the early pandemic. Same period in 2025 ran 70–75%. 823 properties went to auction the week of 23 May, up 33% on the prior week — vendor urgency, not seasonal lift. Source: Domain auction results + Aus Property Professionals 26 May.
- The 12 May 2026 Budget ring-fenced negative gearing on established residential properties purchased after 7:30pm 12 May 2026 from 1 July 2027. Westpac estimates a 34% fall in new investor activity and 20% decline in total dwelling turnover. CBA estimates a ~3% Sydney price discount attributable to the reform alone. New builds remain exempt. See our full 12 May contract-rule analysis.
- Run the numbers at your actual income. The loan calculator uses the May 2026 4.35% cash rate + APRA +3% buffer. The negative gearing calculator distinguishes pre-12-May vs post-12-May purchase logic. The NSW stamp duty calculator applies the $800k FHBAS threshold. The CGT calculator handles the indexation + 30% minimum tax reform.
The May 2026 split — three Australias in one property market
Australia does not have "a property market" right now. It has three. The Cotality (formerly CoreLogic) Home Value Index for April 2026 lifted just 0.3% nationally — the slowest monthly reading since January 2025. Under that single national number sit wildly different city-level realities.
| Capital city | April 2026 monthly | Annual growth | Median dwelling | Trend |
|---|---|---|---|---|
| Sydney | −0.6% to −0.7% | Below Oct 2025 peak | $1,292,157 | 5-month decline |
| Melbourne | −0.6% | Falling | — | 5-month decline |
| Perth | +2.1% | +24.3% | $1,017,698 | Still leading |
| Brisbane | Positive (slowing) | Strong | — | Decelerating |
| Adelaide | Positive (slowing) | Strong | — | Decelerating |
Capital city dwelling value changes for April 2026. Source: Cotality Home Value Index (cotality.com.au); IBTimes (ibtimes.com.au) for Sydney sub-component figures.
Sarah is 34, an IT analyst in Sydney earning $115,000 — her partner earns $85,000. They have been watching a 3-bedroom house in Marrickville. The asking price dropped from $1.61M in October 2025 to $1.52M last week. That is consistent with the Cotality data — Sydney's top-quartile is now trading below its October 2025 levels, with the broad median sitting roughly 1.0% below the November peak.

Why borrowing power matters more than ever (the $54K squeeze)
The RBA's third consecutive 25-basis-point hike on Tuesday 5 May 2026 took the cash rate to 4.35% — the highest since 2011 and a full unwind of every cut delivered in 2025. The headline is mortgage repayments. The under-the-headline story is borrowing capacity.
Industry estimates from finance brokers in early May 2026 put the impact at roughly −$18,000 of borrowing capacity for every 25-basis-point hike for a median-income household. After 75 basis points of 2026 tightening across the three hikes, that compounds to approximately −$54,000 of borrowing ceiling versus where the same household sat in January 2026.
Why it happens: under APRA's prudential serviceability standard, lenders must assess your repayment ability at the contracted rate plus 3.0% (with a floor of 5.25%). When the contracted rate climbs, the assessed rate climbs alongside it — and your assessed repayment under the buffer rises faster than your income.
James is 32, a Perth accountant earning $98,000 with $65,000 saved. In January 2026, James was pre-approved at $640,000. The same lender, same income, same expenses, would now pre-approve him at roughly $586,000 — a $54,000 reduction. In Perth that is the gap between a Belmont 3-bedder and a Gosnells 4-bedder. The neighbourhoods are 12 km apart and the markets behave differently.
"Each 0.25% increase reduces borrowing capacity for a median-income household by approximately $18,000. After 75bp of tightening, the typical investor's ceiling has fallen by roughly $54,000 since January."— Lagos Financial broker analysis, May 2026
Apply the APRA +3% buffer to your income and see what you can actually borrow at the May 2026 rate — not the January figure your old pre-approval ran on.
Check My Borrowing Power → Free · APRA-compliant buffer · No signup
Where prices are falling — and how far
Two of the three biggest capital markets are now in early-phase decline:
- Sydney: Top-quartile properties have fallen for five consecutive months, sitting below October 2025 levels. April 2026 reading −0.6% to −0.7%. The broad median is roughly 1.0% below the November 2025 peak. Median dwelling: $1,292,157.
- Melbourne: Down 0.6% in April. Five months into the early phase of decline. The CBD and high-density inner-ring are leading the softness.
These are not panic numbers. They are not the "30%-off" headlines from 1990 or 2008. But the direction matters more than the magnitude when you are timing a 30-year mortgage.
The MacroBusiness modelling published in early May 2026 floats a thesis that house prices could see "their largest decline in 40 years" if the rate environment holds — that view is not consensus. Cotality's own outlook describes a "softer landing" rather than a crash.

Where prices are still booming — and the submarkets to watch
Perth is doing the heavy lifting for the national index, and the within-city dispersion is even more dramatic than the city-level dispersion. The REIWA market forecast for 2026 is still constructive.
Cotality's submarket data for the year to March/April 2026 shows several Perth corridors with annual growth above 25%:
| Perth submarket | Annual growth (YoY) |
|---|---|
| Serpentine-Jarrahdale | +31.5% |
| Armadale | +30.5% |
| Belmont-Victoria Park | +29.2% |
| Gosnells | +27.5% |
| Kwinana | +26.7% |
Cotality Home Value Index, annual change for selected Perth submarkets, year to March/April 2026.
These are not boutique single-postcode anomalies — they are entire corridors. Brisbane and Adelaide are also still positive, though both are decelerating. For first home buyers eyeing Brisbane's still-rising tier, the upfront cost picture is unusually favourable: QLD's transfer duty scheme charges $0 on new homes at any price and $0 on existing homes up to $700,000. Model the all-in upfront cost — duty + registration + conveyancing — with the QLD stamp duty calculator.
James (continued): His $586K post-RBA ceiling lands him comfortably in Gosnells or Armadale (median ~$520–$580K), but locks him out of Mount Lawley or Subiaco entirely. His next decision is therefore not "Perth vs Sydney" — it is "which Perth corridor still has growth runway after a +27% year, and how much further can it stretch before the rate environment catches up here too?"
A $580K Perth purchase carries roughly $25K in WA stamp duty — real cash on top of your deposit. Run the number for your state before the first inspection.
Calculate WA Stamp Duty → All 6 states · First-home-buyer + foreign-buyer logicBuy now or wait? The decision framework
There is no universal answer. But there is a universal framework.
Buy now if:
- The corridor you want is in the rising tier (Perth, Brisbane, Adelaide, regional)
- Your borrowing capacity at the May 2026 rate (4.35% cash / ~5.85% mortgage / 8.85% assessed) is approved for the asking price
- Your DTI under the APRA buffer is under 6×
- You have ≥5% genuine savings held ≥3 months
- The discount-to-listing on your shortlist is less than the borrowing-capacity squeeze you have already absorbed (because waiting will not net you a better deal)
Wait if:
- The corridor you want is in the falling tier (Sydney top-quartile, Melbourne inner-ring) AND your serviceability is borderline
- You are stretching to >35% of net income on repayments at the May 2026 rate
- Your job security has deteriorated since pre-approval
- You can save another $15,000–$25,000 over the next 6 months — that may now matter more than a 1–2% price correction
"The risk in 2026 is not buying at the top. It is buying at a price you cannot service if the RBA delivers one more hike."— Cotality outlook commentary, April 2026
How to buy smart in a fragmented market
Five concrete moves for the next 6–8 weeks:
- Re-run your numbers at the May 2026 rate. If your pre-approval is from January or February, it is wrong. Re-submit.
- Use the Velofy loan calculator before every inspection. Plug in the asking price, see the post-APRA-buffer repayment, walk in informed.
- Stamp duty before you fall in love. Most buyers underestimate state stamp duty by $10,000–$20,000. Use the Velofy stamp duty calculator for your state before the first inspection.
- Don't anchor on the listing price. In a falling market, the listing price is a ceiling, not a benchmark. In a rising market, it is a floor.
- Shortlist 3 cities, not 3 suburbs. The May 2026 split rewards optionality. If your job is remote-capable, Perth or Adelaide may give you 2× the dwelling for the same loan as Sydney.
Velofy may earn a commission on qualifying purchases made through Amazon AU links on this page, at no extra cost to you.
Books on Australian property strategy are deductible against assessable rental income if you already hold an investment property — not deductible for owner-occupied buyers. Updated for the 2025–26 rate environment.
Shop on Amazon AU →A $50 meter does not replace a $600 professional building inspection — but it can save you booking one on the wrong property by flagging rising damp or hidden plumbing leaks before you waste an inspector's time.
Shop on Amazon AU →Insurance settlements move faster when the original Certificate of Title, contract of sale, and council rates record are recoverable. A4 fits the contract pack from your conveyancer without folding.
Shop on Amazon AU →
The bottom line
The May 2026 property market does not reward one strategy. It rewards optionality, accurate borrowing math, and a willingness to look beyond the city your friends live in.
Before the next open inspection, run two numbers through Velofy: your real post-APRA-buffer borrowing capacity, and the stamp duty on the state you actually plan to buy in. Both are free, both are private, and both will reframe what your shortlist should look like.
Check your post-RBA borrowing capacity and your state stamp duty before you set foot at the next open home.
Check My Borrowing Power → Free · No account needed · 100% privateFrequently Asked Questions
Are Australian house prices falling in 2026?
Mixed. Sydney and Melbourne have recorded five consecutive months of decline through April 2026, with Sydney's top-quartile now below October 2025 levels (median ~$1.29M). Perth, Brisbane, and Adelaide are still rising — Perth at +24.3% annually. The national Cotality Home Value Index lifted just 0.3% in April 2026, the slowest monthly reading since January 2025. Source: Cotality (cotality.com.au).
How much has the 4.35% rate cut into borrowing capacity?
Industry broker estimates suggest each 25-basis-point hike reduces a median-income household's borrowing capacity by approximately $18,000 under APRA's +3% serviceability buffer. After 75bps of tightening in 2026 (three hikes), that compounds to roughly $54,000 of reduced borrowing ceiling versus January 2026. A pre-approval issued before May 2026 is no longer accurate. Sources: Lagos Financial, CommBank.
Is it better to buy in Perth or Sydney in 2026?
It depends on borrowing capacity, job mobility, and target dwelling type. At a $586,000 borrowing ceiling, Perth delivers a 3–4 bedroom corridor home (Gosnells, Armadale, Belmont); the same loan in Sydney buys a 1-bedroom apartment in middle suburbs. Perth's +24.3% annual growth carries momentum risk — a +27% year does not mean +27% next year. Sydney's 1% peak-to-current correction is too small to recover the borrowing-capacity squeeze that buyers absorbed waiting. Source: Cotality, REIWA.
What is the APRA serviceability buffer in 2026?
APRA requires regulated lenders to assess a borrower's serviceability at the contracted mortgage rate plus 3.0%, with a floor of 5.25%. At a 5.85% mortgage rate in May 2026, assessment runs at approximately 8.85%. The buffer is non-negotiable. When the contracted rate rises, the assessed rate rises alongside it — which is why borrowing capacity contracts even if your income has not changed. Source: APRA Prudential Standard APG 223.
Should I wait for a bigger price correction before buying?
Only if your target market is actively falling AND your serviceability is borderline at today's rates. If your target is Perth, Adelaide, Brisbane, or a regional market, waiting is more likely to cost you growth than save you on price. If your target is Sydney top-quartile or Melbourne inner-ring AND you can save another $15,000–$25,000 over six months, waiting may improve your deposit ratio more than the price correction will improve the listing. Source: Cotality outlook, APRA serviceability rules.
Sources
- Cotality (CoreLogic) — Home Value Index, April 2026 Outlook
- PropertyUpdate — National Housing Market Update, April 2026
- REIWA — Strong Price Growth Forecast Perth 2026
- IBTimes — Sydney Top-Quartile 5-Month Decline
- CommBank — RBA May 2026 Rate Decision Analysis
- Reserve Bank of Australia — Cash Rate Target
- APRA — Prudential Standards
- Lagos Financial — RBA 2026 Rate Hikes & Borrowing Capacity