Gross rental yield is simply the annual rent a property earns, divided by what it costs to buy — expressed as a percentage. A $600-a-week unit bought for $500,000 earns $31,200 a year, or a 6.2% gross yield. It's the quickest way to compare how hard your money works across different NSW postcodes, and the gap between the highest- and lowest-yielding areas in this state is enormous. Below are the actual top 10 postcodes by gross yield for units and for houses, pulled straight from NSW Valuer-General sales records and NSW Fair Trading bond lodgements — the same live dataset behind our Sydney Rental Yield Map.
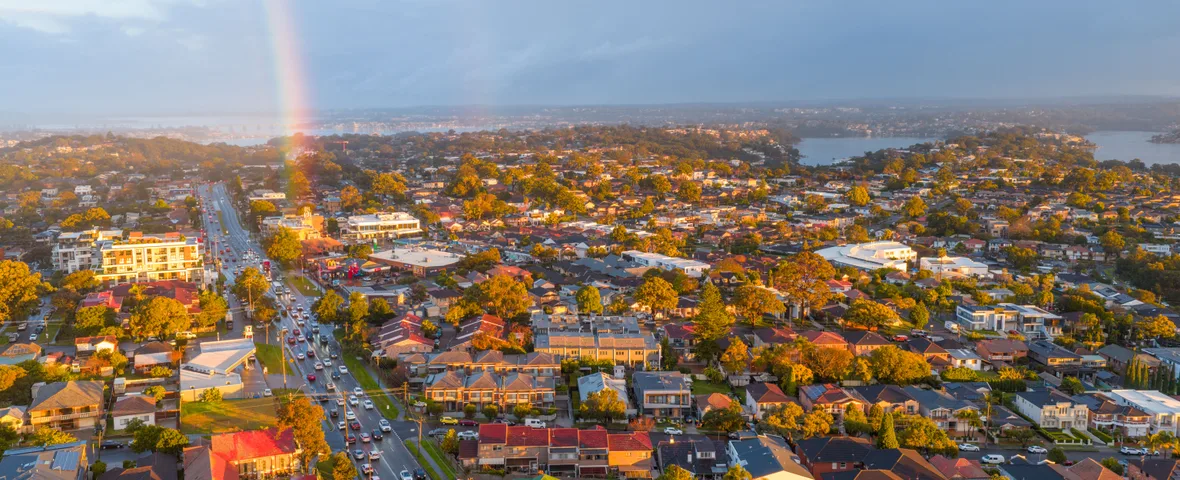
Top 10 unit postcodes by gross yield
Every postcode below has at least 30 recorded unit sales and 30 bond lodgements in the data window, so these aren't thin, noisy figures — unit sample sizes here range from 63 to 1,329 sales, and 74 to 5,031 bond lodgements.
| # | Postcode | Suburbs | Gross yield | Median rent | Median price |
|---|---|---|---|---|---|
| 1 | 2008 | Darlington, Chippendale | 6.2% | $890/wk | $745,000 |
| 2 | 2161 | Old Guildford, Guildford | 6.0% | $550/wk | $475,000 |
| 3 | 2036 | Chifley, Phillip Bay | 6.0% | $1,080/wk | $940,000 |
| 4 | 2150 | Parramatta, Harris Park | 5.9% | $700/wk | $620,000 |
| 5 | 2017 | Zetland, Waterloo | 5.9% | $1,060/wk | $940,000 |
| 6 | 2142 | Granville, Blaxcell | 5.9% | $600/wk | $532,000 |
| 7 | 2165 | Fairfield Heights, Fairfield West | 5.8% | $530/wk | $475,000 |
| 8 | 2020 | Sydney & Sydney Domestic Airports | 5.8% | $1,000/wk | $900,000 |
| 9 | 2830 | Troy Junction, Dubbo | 5.7% | $390/wk | $357,500 |
| 10 | 2333 | Sandy Hollow, Wybong | 5.7% | $360/wk | $331,000 |
Figures as at July 2026. Rent window: bond lodgements August 2025–May 2026 (NSW Fair Trading Rental Bond Data, CC-BY). Sales window: settled 2025 (NSW Valuer-General Property Sales Information, CC-BY). Postcode medians, not valuations — individual properties vary.
The mix here is notable: it isn't only cheap regional postcodes. Inner and middle-ring Sydney unit markets — Darlington near Sydney University, Zetland and Waterloo in the Green Square renewal precinct, Parramatta's CBD fringe — out-yield much of the rest of the state because strong rental demand keeps rents high relative to what units there actually cost to buy. Compare that to the premium eastern beaches or lower north shore, where unit prices are far higher but rents don't rise proportionately, dragging yields down.
Top 10 house postcodes — and why regional NSW dominates
House yields tell a much simpler story. Every single postcode in the top 10 is regional or remote NSW — house sample sizes here range from 40 to 657 sales, and 30 to 272 bond lodgements.
| # | Postcode | Suburbs | Gross yield | Median rent | Median price |
|---|---|---|---|---|---|
| 1 | 2840 | Louth, Gumbalie | 9.3% | $300/wk | $167,500 |
| 2 | 2880 | Little Topar, Mutawintji | 9.0% | $360/wk | $208,000 |
| 3 | 2877 | Kiacatoo, Euabalong | 8.1% | $375/wk | $240,000 |
| 4 | 2357 | Coonabarabran, Ulamambri | 7.5% | $395/wk | $275,000 |
| 5 | 2820 | Wellington, Wuuluman | 7.3% | $470/wk | $335,000 |
| 6 | 2388 | Cuttabri, Wee Waa | 7.3% | $445/wk | $319,250 |
| 7 | 2835 | Sandy Creek, Lerida | 6.7% | $360/wk | $280,000 |
| 8 | 2563 | Menangle Park | 6.4% | $750/wk | $609,000 |
| 9 | 2660 | Culcairn, Carnsdale | 6.4% | $430/wk | $350,000 |
| 10 | 2671 | West Wyalong, Wyalong | 6.3% | $450/wk | $369,500 |
Figures as at July 2026. Rent window: bond lodgements August 2025–May 2026 (NSW Fair Trading Rental Bond Data, CC-BY). Sales window: settled 2025 (NSW Valuer-General Property Sales Information, CC-BY). Postcode medians, not valuations — individual properties vary.
Regional NSW dominates the house rankings for one structural reason: house yield is rent divided by price, and outback and far-western postcodes like Louth and Little Topar have median house prices under $210,000 — a fraction of Sydney's. Even a modest weekly rent produces a high percentage yield against such a small base. It's a mathematical effect, not a sign these are booming rental markets. Menangle Park, on Sydney's south-western growth fringe, is the one outlier close to metro Sydney to crack the top 10 — a newer growth-area house price still low enough relative to rent to clear 6%.
The Sydney Rental Yield Map colours all 560+ NSW postcodes by gross yield, rent or price, for units and houses — zoom from all of NSW down to Sydney suburb level and hover any postcode for its exact figures.
Explore the map →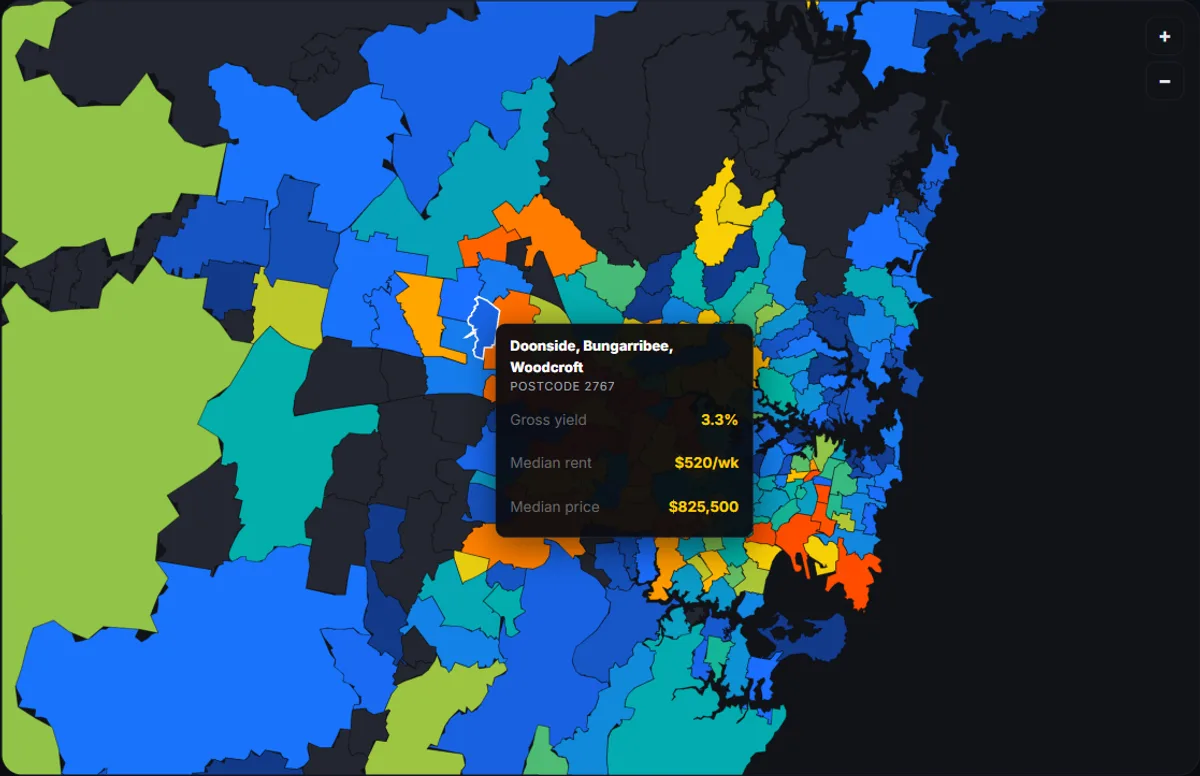
Why a high yield isn't automatically a good investment
A high gross yield is one number out of several that matter, and treating it as the whole picture is how investors end up in thin, high-risk markets. Before chasing any postcode on the tables above, weigh it against:
- Gross yield ignores costs. Property management fees, council rates, strata or body corporate, insurance, maintenance, vacancy periods and loan interest all come out of that headline rent. Net yield — after these — typically runs 1–2 percentage points lower, and for a leveraged purchase, interest costs alone can turn a "good" gross yield into a cash-flow loss. Model your own numbers with the negative gearing calculator to see the after-tax cash-flow position, not just the yield.
- High yield often means low capital growth expectations. Markets price risk and growth prospects into both rent and price. A postcode with a rock-bottom median price and high yield, like several of the regional postcodes above, can also mean thin demand, limited employment base, and flat or falling long-term values.
- Vacancy risk is higher in thin regional markets. A property in a small town with one major employer can sit vacant for months if that employer contracts. Sydney's inner-ring high-yield unit postcodes carry lower vacancy risk simply from deeper, more diverse tenant demand.
- These are postcode medians, not valuations. Your specific property will differ from the postcode-wide median rent and price — sometimes significantly. Use these figures to compare areas, not to price an individual property.
How to check your own suburb
If you already own a rental property, or you're comparing a suburb you're considering buying into, the two tables above only cover the extremes — the top 10 out of 560+ NSW postcodes with enough data to publish. To check any specific postcode:
- Open the Sydney Rental Yield Map and zoom to your suburb — hover any postcode to see its gross yield, median weekly rent and median sale price for units and houses side by side.
- Run your own numbers through the NSW Rental Yield Calculator — enter your actual purchase price and expected (or actual) rent to get a personalised gross and net yield, rather than relying on the postcode median.
- If you're setting or reviewing the rent on an existing property, check it against the local median first with the NSW Rent Gap Calculator — it flags whether you're under-renting relative to your postcode.
All three tools use the same underlying NSW Valuer-General and Fair Trading dataset behind this article.
Sources verified for this article (July 2026)
- NSW Valuer-General — Property Sales Information (settled sales, 2025 window), Creative Commons BY licence
- NSW Fair Trading — Rental Bond Data (new tenancy bond lodgements, August 2025–May 2026 window), Creative Commons BY licence
- Australian Bureau of Statistics — Postal Areas (POA) 2021 boundaries, used to group sales and bonds by postcode
Frequently Asked Questions
What is a good rental yield in NSW?
There's no single official benchmark, but as a rule of thumb, gross yields above 5% are considered strong for NSW residential property in 2026 — the median across our full postcode dataset sits well below that for both units and houses. Anything above 6% (as the top unit and house postcodes here show) is well above typical Sydney metro yields, which often sit in the 2.5%–4% band for established houses. A higher yield generally trades off against lower capital growth expectations, higher vacancy risk, or both — it isn't automatically "better," just different.
Are high-yield postcodes always regional or outer-metro?
For houses, yes, almost entirely — the top 10 house postcodes here are all regional or remote NSW, where median prices are low enough that even modest rents produce a high yield. For units it's more mixed: several of the top 10 unit postcodes are inner and middle-ring Sydney suburbs (Darlington, Zetland, Waterloo, Parramatta) where strong rental demand from students and professionals keeps rents high relative to unit prices, alongside cheaper regional centres like Dubbo.
How current is this data?
Rents are calculated from NSW Fair Trading bond lodgements for new tenancies between August 2025 and May 2026 — the most recent window with enough lodgements to publish reliable medians. Sale prices are from NSW Valuer-General property sales settled in 2025, the latest full year available; 2026 sales data is still being finalised by the Valuer-General and isn't yet complete enough to publish. We date-stamp every figure so you know exactly which period it reflects.
Does gross yield account for costs like agent fees, strata and repairs?
No — gross yield is rent (annualised) divided by price, before any costs are deducted. It ignores property management fees, strata or council rates, insurance, maintenance, vacancy periods and loan interest. Net yield (after those costs) is typically 1–2 percentage points lower than gross yield. Treat every figure on this page as a starting-point indicator, not a return you'll actually pocket.
Can I check the exact yield for my own suburb or property?
Yes. The postcode figures here are medians across many properties, so your specific address will differ. Use the Sydney Rental Yield Map to browse any NSW postcode's yield, rent and price, or the NSW Rental Yield Calculator to enter your own numbers — purchase price, expected rent, and running costs — and get a personalised gross and net yield. And if a property's yield has you weighing an exit instead, model the sale option with our Property Sale Profit Calculator — it returns the true walk-away figure after loan interest, selling costs and CGT.